  |
| |
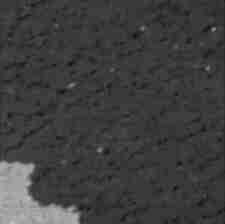
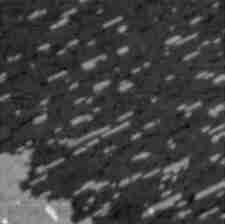
Figure 2. 800 × 800 Å STM images from a longer movie showing the growth of 1D islands at 523 K. Time advances from left to right. Coverage increases from 0 to 0.07 ML. The movie begins with the clean substrate before deposition. One can follow individual islands from frame to frame as they grow. View Java Applet Movie or View GIF Animation
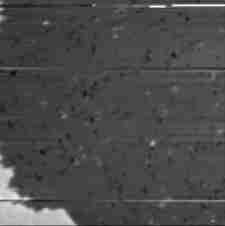 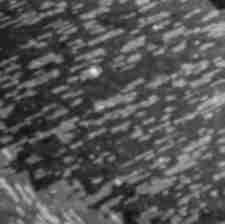 |
Figure 3. 800 × 800 Å STM images showing the growth of islands at 533 K. Time advances from left to right. Coverage increases from 0 to 0.1 ML at a rate of approximately 0.01 monolayers deposited per frame. The movie begins with the clean substrate before deposition. At this temperature 1-D islands form and coalesce. View Java Applet Movie or View GIF Animation